Reading and interpreting data from databases or spreadsheets is challenging.

Replace static spreadsheets with auto-generated, dynamic process visualizations and analysis in Qlik.


Reading and interpreting data from databases or spreadsheets is challenging.

Consolidating data is time-consuming, and the output is static and outdated.

Manual IT efforts required to collect and present data hinder process analysis.
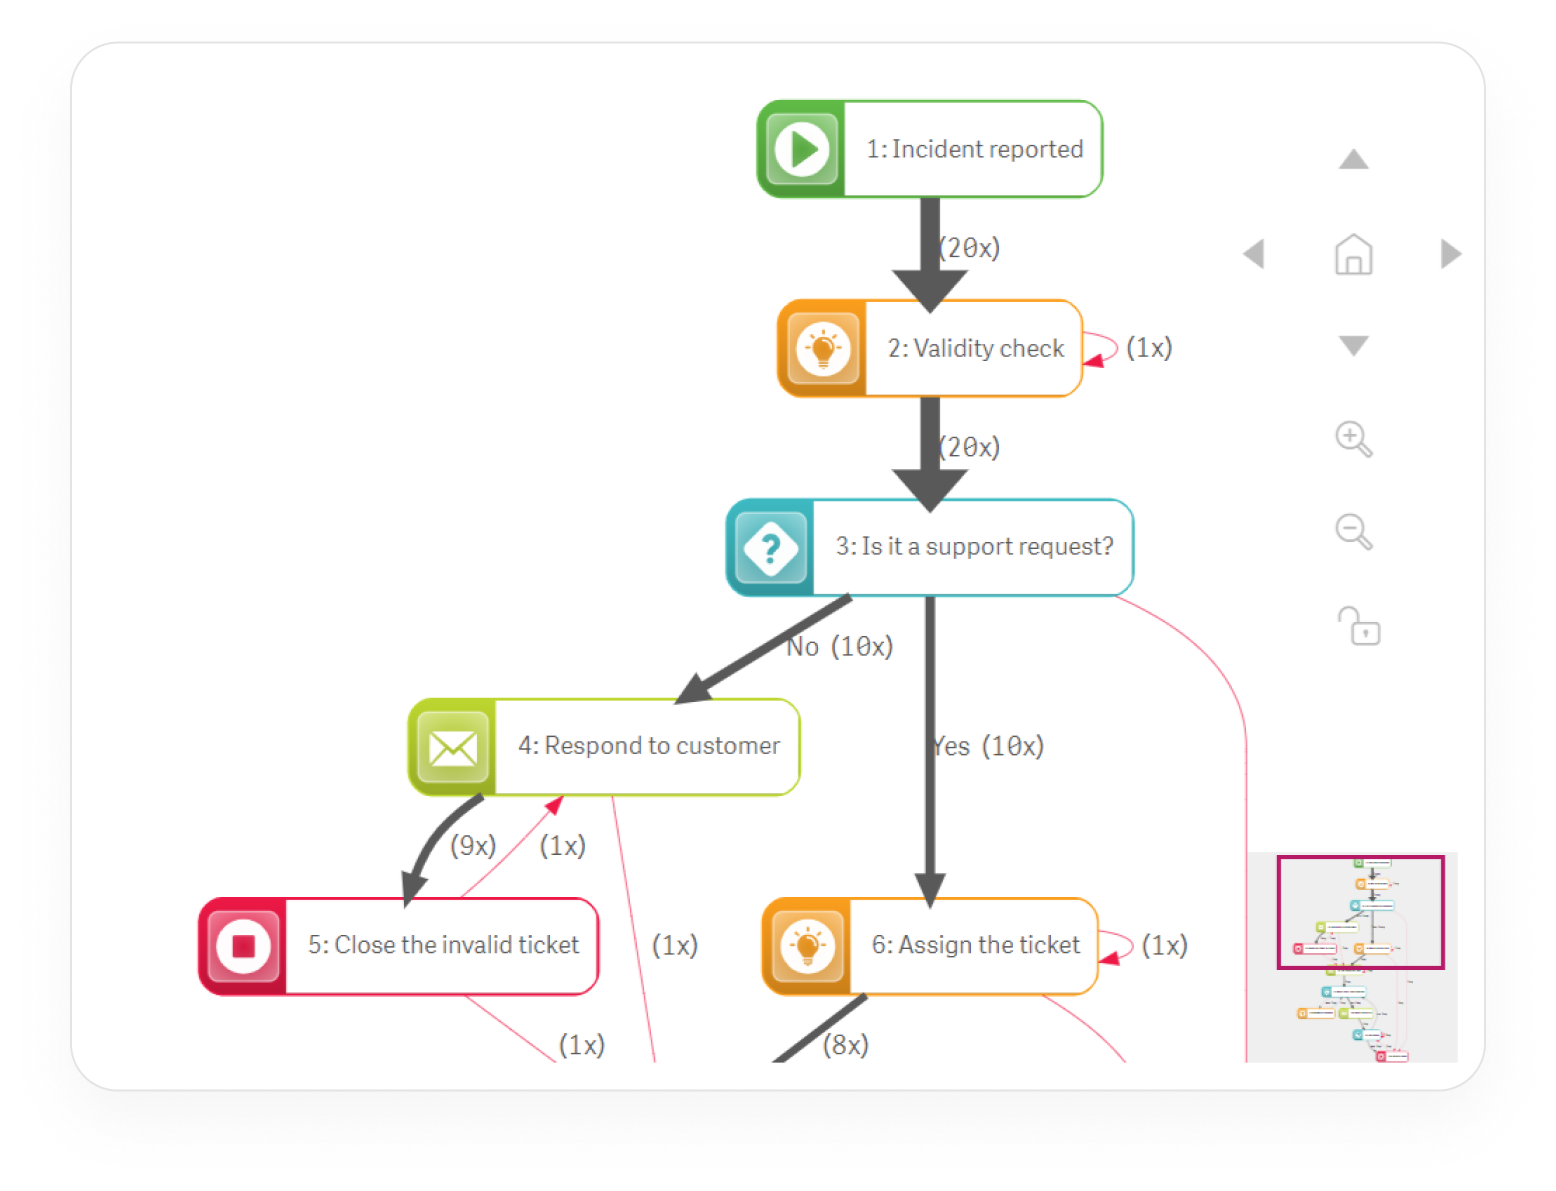
Inphinity Flow auto-generates your actual process flow directly from Qlik data. Compare it with the ideal process flow to instantly identify inefficiencies and quality issues.
Enhance process transparency and comprehension through guided navigation and contextual insights. Interactive elements and triggers within the flow diagram engage and inform users.

Analyze each step of your metrics calculations and perform simulations for real-time process analysis. Enhance understanding and support audit activities by improving accessibility to insights.

Eliminate the need for your IT team to manually collect, consolidate, and update process data. Inphinity Flow connects directly to your Qlik data for real-time, dynamic visualizations.


Customize hierarchies to view an up-to-date organizational chart and breakdown of KPIs.

Evaluate complex networks such as transportation routes, network architecture, and project dependencies.

Visualize past performance and future projections with a comprehensive calendar view.
Inphinity distributes its products through a global partner program, working closely with partners and customers to push the boundaries of data analytics and creating solutions to increase efficiency, reduce costs and improve Qlik user satisfaction.